|
|
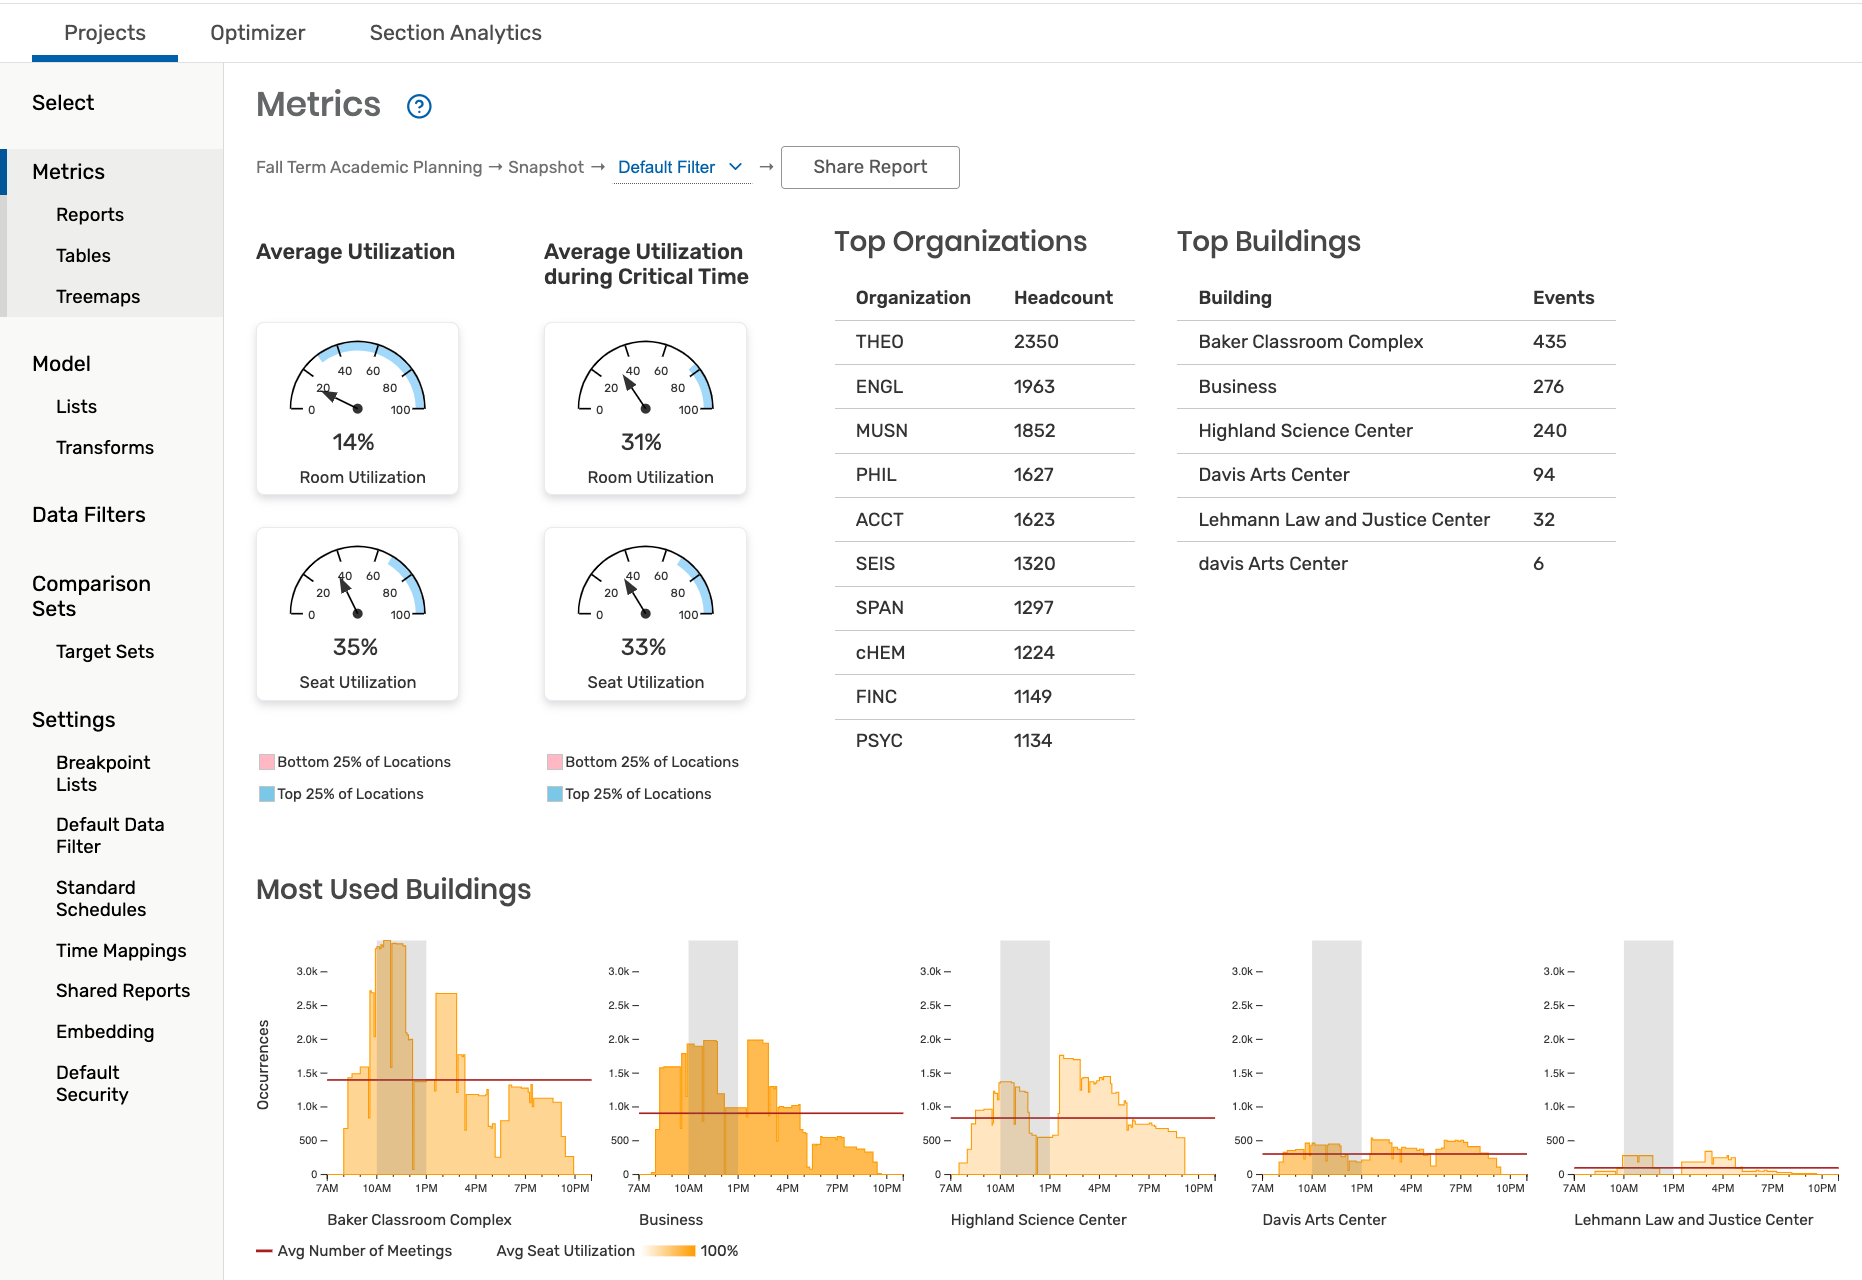 Image: Metrics dashboard in X25 Analytics.
Powerful Analytics and Modeling to Support Decision Making
X25 is the only tool of its kind on the market today providing detailed presentations and the underlying hard data to directly benefit your institution. The graphical reporting, master planning, modeling, and data warehouse abilities in X25 use historically accurate data exported from the Series25 database to generate clear, colorful, information-rich graphs to help space planners and other decision-makers evaluate space usage and utilization to determine how well space is meeting the needs of departments and students, and where changes are needed.
Reminder: Every Series25 Customer Has Access to Limited X25 Features
All customers have access to a limited version of X25 Analytics regardless of their licensing status, including Schedule25 Optimizer modeling. See X25 Analytics - Limited Features.
Features and Benefits
|
|
Generate data to support your scheduling decisions as well as reports required by your state or trustees or needed to position your institution to obtain funding |
|
|
Demonstrate where more space is needed and where construction, closures, or reallocations may be possible |
|
|
Identify peak time slots and provide departments the analysis and guidance to meet the academic needs of departments, faculty, and students |
|
|
View and compare results for critical periods, such as drop/add date, end-of-term and census data |
|
|
Compare levels of demand among venues to identify where the need for new facilities is greatest |
|
|
Pinpoint room utilization and scheduling patterns that identify problems and opportunities to improve the use of each location |
|
|
Customize parameters and scope of analytics to evaluate how your specific location inventory is meeting needs |
How does X25 fit into Series25?
You can export data to X25 for analysis. With the X25 data analytics and modeling tools, extensive data variations can be studied under a variety of scenarios, including building and schedule changes. You can then run your chosen scheduling scenarios through the Schedule25 Optimizer for optimal placement.
 Image: Treemaps in X25 Analytics.
We Love Your Feedback
We would love to get your feedback about what you like, don't like, or any problems you encounter:
- Account Managers: series25implementation@collegenet.com
- General Feedback: productdevelopment@collegenet.com